This article provides a detailed analysis of SANDUMA Share Price Target from 2025 to 2030 and its share history. It covers current performance, historical trends, financial growth, and future potential. In this article, we also discuss key investors, shareholding pattern, market position, and expert forecasts.
Overview of (SANDUMA) Sandur Manganese and Iron Ores Ltd.
What is The Sandur Manganese & Iron Ores Limited (SANDUMA)?
The Sandur Manganese & Iron Ores Limited (SMIORE), commonly known as SANDUMA, is a prominent Indian mining and manufacturing company founded in 1954. It is the flagship enterprise of the Karnataka-based Sandur Group. Headquartered in India, the company is primarily engaged in the mining of low-phosphorous manganese and iron ore in the Hosapete-Ballari region of Karnataka. In addition, it manufactures ferro-alloys—such as silico-manganese and ferro-manganese—and produces coke at its Vyasankare plant near Hospet.
Key Features of SANDUMA (SMIORE)
- Market Role: SANDUMA is the third-largest manganese ore miner in India, playing a crucial role in the domestic steel and ferro-alloy supply chain.
- Core Business Activities: Engaged in the mining of manganese and iron ore, and the production of ferro-alloys and coke—key raw materials for the steel industry.
- Operational Region: Operates extensively in Karnataka’s mineral-rich Hosapete-Ballari belt, known for high-quality ore deposits.
- Strategic Manufacturing: Runs a ferro-alloy and coke manufacturing facility in Vyasankare, boosting its value-added offerings.
- Parent Organization: A part of Skand Private Limited, providing it with strong group-level financial and operational backing.
- Subsidiaries: Includes Arjas Steel Pvt Ltd, Sandur Pellets Private Limited, and Star Metallics and Power Private Limited, expanding its footprint in steel and power sectors.
- Workforce: Employs 2,528 people (as of 2024), reflecting its scale and operational capacity within the Indian mining and manufacturing landscape.
Information about Sandur Manganese & Iron Ores Limited (SANDUMA)
| Information | Details |
|---|---|
| Website | sandurgroup.com |
| Headquarters | India |
| Founded | 1954 |
| Founder | Shri Murarirao Yeshwantrao Ghorpade |
| Parent Organization | Skand Private Limited |
| CEO | Not publicly disclosed |
| Stock Exchange Listings | BSE: 504918, NSE: SANDUMA |
| Core Operations | Mining of manganese & iron ore, manufacturing of ferro-alloys and coke |
| Manufacturing Facility | Vyasankare plant near Hospet, Karnataka |
| Employees | 2,528 (as of 2024) |
| Industry Position | 3rd largest manganese ore miner in India |
| Key Subsidiaries | Arjas Steel Pvt Ltd, Sandur Pellets Pvt Ltd, Star Metallics and Power Pvt Ltd |
Current Price Overview of SANDUMA Share Price
Sandur Manganese & Iron Ores Limited (SANDUMA) Share Fundamental Data
| Fundamental Metric | Value |
|---|---|
| Market Cap | ₹7,785 Cr. |
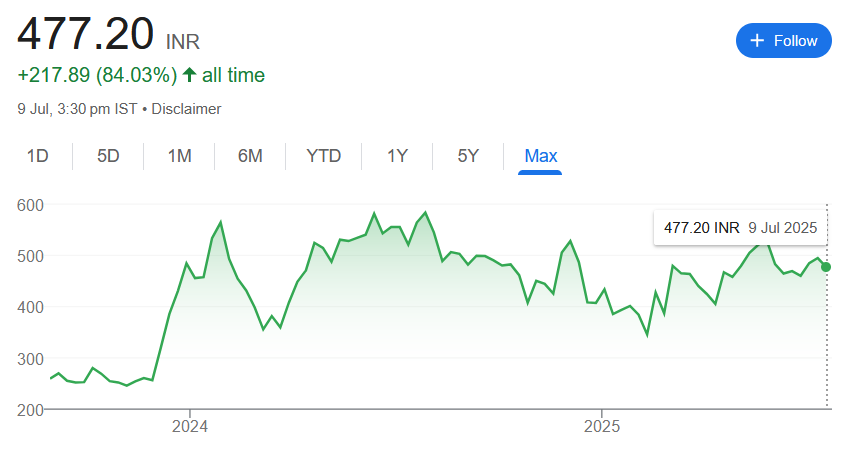
| Current Price | ₹480 |
| 52-Week High / Low | ₹615 / ₹337 |
| Stock P/E | 16.5 |
| Book Value | ₹161 |
| Dividend Yield | 0.21% |
| ROCE | 21.8% |
| ROE | 19.7% |
| Face Value | ₹10.00 |
Market Position of Sandur Manganese (SANDUMA) Share as of July 2024
As of July 2024, Sandur Manganese (SANDUMA) shares have delivered steady short-term gains, increasing by 1.29% in a day and 2.02% over the past week. Over the past month, the stock rose 2.42%, while its three-month performance saw a solid 22.02% gain, reflecting positive investor sentiment and operational stability. However, the stock declined -16.02% over the past year, indicating some long-term headwinds. Data for 3-year and 5-year returns is currently not available, but SANDUMA maintains a strong niche position as India’s third-largest manganese ore miner.
| Time Period | Returns of SANDUMA Share |
|---|---|
| 1 Day | +1.29% |
| 1 Week | +2.02% |
| 1 Month | +2.42% |
| 3 Months | +22.02% |
| 1 Year | -16.02% |
| 3 Years | N.A. |
| 5 Years | N.A. |
Sandur Manganese (SANDUMA) Share Price Target (2025–2030)
SANDUMA Share Price Target for 2025
In 2025, SANDUMA shares are projected to trade between ₹520 – ₹600, backed by improved commodity demand, manufacturing expansion, and recovery in metal prices.
| Year | Minimum Target (₹) | Maximum Target (₹) |
|---|---|---|
| 2025 | 520 | 600 |
SANDUMA Share Price Target for 2026
By 2026, the share may range between ₹580 – ₹700, driven by growing exports of ferro-alloys, stable mining output, and favorable pricing trends in steel-related industries.
| Year | Minimum Target (₹) | Maximum Target (₹) |
|---|---|---|
| 2026 | 580 | 700 |
SANDUMA Share Price Target for 2027
In 2027, with consistent growth and diversification into value-added products, the stock could trade between ₹660 – ₹850.
| Year | Minimum Target (₹) | Maximum Target (₹) |
|---|---|---|
| 2027 | 660 | 850 |
SANDUMA Share Price Target for 2028
For 2028, SANDUMA may rise further to ₹750 – ₹1,000, as the company leverages economies of scale, new technology adoption, and increased domestic demand.
| Year | Minimum Target (₹) | Maximum Target (₹) |
|---|---|---|
| 2028 | 750 | 1,000 |
SANDUMA Share Price Target for 2029
By 2029, with sustained profits and capacity expansion, the share could reach ₹900 – ₹1,250, reflecting confidence in the core mining and alloy businesses.
| Year | Minimum Target (₹) | Maximum Target (₹) |
|---|---|---|
| 2029 | 900 | 1,250 |
SANDUMA Share Price Target for 2030
In 2030, Sandur Manganese’s share price is forecasted to reach ₹1,050 – ₹1,500, supported by long-term mining reserves, downstream integration, and rising steel-sector demand.
| Year | Minimum Target (₹) | Maximum Target (₹) |
|---|---|---|
| 2030 | 1,050 | 1,500 |
SANDUMA Share Price Target for Tomorrow
Sandur Manganese (SANDUMA) Share Price History from (2006–2025)
| Year | Closing Price (₹) | YoY Change (%) |
|---|---|---|
| 2025 | ₹480.35 | +16.2% |
| 2024 | ₹413.25 | -14.5% |
| 2023 | ₹483.22 | -40.7% |
| 2022 | ₹813.80 | -2.1% |
| 2021 | ₹831.08 | +130.4% |
| 2020 | ₹360.57 | +53.4% |
| 2019 | ₹235.01 | -32.1% |
| 2018 | ₹345.84 | -14.4% |
| 2017 | ₹403.96 | +56.3% |
| 2016 | ₹258.38 | +62.7% |
| 2015 | ₹158.77 | -15.5% |
| 2014 | ₹187.80 | -9.5% |
| 2013 | ₹207.45 | +58.8% |
| 2012 | ₹130.59 | -54.8% |
| 2011 | ₹288.86 | -60.1% |
| 2010 | ₹723.25 | +48.4% |
| 2009 | ₹487.10 | +87.7% |
| 2008 | ₹259.40 | -41.4% |
| 2007 | ₹442.15 | +811.6% |
| 2006 | ₹48.50 | – |
Sandur Manganese (SANDUMA) Financial Performance (FY 2023 – FY 2025)
| Annual | FY 2025 | FY 2024 | FY 2023 |
|---|---|---|---|
| Total Revenue (₹ Cr.) | 3,212.18 | 1,334.80 | 2,185.01 |
| Revenue Growth (%) | 140.65 | -38.91 | 202.82 |
| Total Expenses (₹ Cr.) | 2,588.04 | 1,009.78 | 1,825.49 |
| Expense Growth (%) | 156.30 | -44.68 | 266.95 |
| PAT (₹ Cr.) | 470.17 | 239.46 | 270.79 |
| PAT Growth (%) | 96.35 | -11.57 | 84.86 |
| Operating Margin (%) | 23.63 | 27.55 | 18.22 |
| Net Profit Margin (%) | 14.99 | 19.12 | 12.73 |
| Basic EPS (₹) | 29.02 | 14.78 | 101.23 |
How to Buy Sandur Manganese (SANDUMA) Shares
- Choose a Broker
Select a reliable stockbroker such as Zerodha, Groww, Upstox, Angel One, or ICICI Direct that allows trading of Sandur Manganese shares (NSE: SANDUMA, BSE: 504918). - Open a Trading & Demat Account
Sign up for both a trading and Demat account with your preferred broker. Popular platforms include:- Zerodha’s Kite
- Groww
- Upstox Pro
- Complete KYC Verification
Upload required documents for identity verification, including:- PAN Card
- Aadhaar Card or Passport
- Bank Account Details
- Add Funds to Your Account
Deposit money into your trading account using UPI, net banking, debit card, or other supported methods. - Search for Sandur Manganese Shares
Locate the company using its stock symbols:- NSE: SANDUMA
- BSE: 504918
- Place Your Order
- Market Order: Buy immediately at the current market rate.
- Limit Order: Set a specific price at which you want to buy.
- Confirm & Execute
Review the order details, quantity, and price before confirming the purchase. - Monitor Your Investment
Track your SANDUMA shares through your broker’s platform or financial websites like NSE India, Moneycontrol, or TradingView.
Shareholding Pattern of Sandur Manganese (SANDUMA) as on May 2025
Promoters:
- Number of Shares: 12,02,58,758
- Percentage: 74.22%
- % Change QoQ: 0.00%
FII (Foreign Institutional Investors):

- Number of Shares: 18,24,444
- Percentage: 1.12%
- % Change QoQ: +0.06%
DII (Domestic Institutional Investors):
- Number of Shares: 22,83,286
- Percentage: 1.41%
- % Change QoQ: -0.06%
Mutual Funds (within DII):
- Number of Shares: 13,22,720
- Percentage: 0.82%
- % Change QoQ: -0.06%
Public (Retail & Others):
- Number of Shares: 3,76,68,450
- Percentage: 23.25%
- % Change QoQ: 0.00%
Peer Competitors of Sandur Manganese in the Energy & Consumable Fuels Sector
| Name | Share Price (₹) | Market Cap (₹ Cr) |
|---|---|---|
| Coal India | 384.00 | 2,36,648.82 |
| Sandur Manganese | 475.90 | 7,711.25 |
| Foundry Fuel | 6.48 | 5.20 |
Challenges and Risks of Investing in Sandur Manganese (SANDUMA)
Operational and Market Risks:
- Business is highly dependent on cyclical industries like steel and infrastructure.
- Regulatory uncertainty around mining licenses and environmental norms.
- Price volatility in manganese and iron ore can impact margins.
- Limited geographic diversification increases regional operational risks.
- Heavy reliance on domestic demand; global scale remains limited.
Financial and Execution Risks:
- Relatively small market cap limits institutional investor interest.
- High fixed costs in mining and alloy manufacturing during downturns.
- Execution challenges in scaling downstream businesses like pellets and power.
- Lower dividend yield may not appeal to income-focused investors.
- Exposure to commodity pricing can cause unpredictable earnings swings.
Sandur Manganese Share Price: Key Growth Drivers
Market Strength & Positioning:
- 3rd largest manganese ore miner in India with strong regional dominance.
- Integrated operations: mining, ferro-alloys, coke, and steel processing.
- Backed by Skand Private Ltd. with strategic support and vision.
- Expanding into value-added sectors like pellets and power generation.
- Long-standing reputation in the Hosapete-Ballari mining belt.
Technology & Financial Potential:

- FY25 revenue grew 140% YoY to ₹3,212 Cr, with solid profit growth.
- Strong ROCE of 21.8% and ROE of 19.7%, indicating operational efficiency.
- Operating margin above 23% shows sound cost and resource control.
- Potential to benefit from India’s infrastructure and steel boom.
- Public and institutional shareholding support shows growing investor confidence.
FAQs
What is the net worth of Sandur Manganese?
As of FY2025, Sandur Manganese & Iron Ores Ltd has a market capitalization of approximately ₹7,711 crore.
When did Sandur Manganese share price split?
Sandur Manganese shares underwent a stock split in September 2023, in the ratio of 1:2, reducing the face value from ₹10 to ₹5.
What is the NSE code for Sandur Manganese?
The NSE stock symbol for Sandur Manganese is SANDUMA.
Is Sandur Manganese a good buy for the long term?
Yes, Sandur Manganese is considered a good long-term investment due to its strong fundamentals, integrated operations, and position as the third-largest manganese miner in India.
Who is the owner of Sandur Manganese?
Sandur Manganese is promoted by Skand Private Limited, which holds the majority shareholding in the company.
Is Sandur Manganese a government company?
No, Sandur Manganese is a privately promoted public limited company and is not government-owned.
What is the bonus ratio for Sandur Manganese?
As of July 2025, there is no recent bonus issue declared by the company.

Which is the largest manganese company in India?
MOIL Limited (Manganese Ore India Ltd) is the largest manganese ore producer in India.
What is the product of Sandur Manganese?
Sandur Manganese produces manganese ore, iron ore, ferro-alloys (silico-manganese, ferro-manganese), and metallurgical coke.
Who is the biggest exporter of manganese?
South Africa is currently the largest exporter of manganese in the world.
Who is the largest producer of manganese in India in 2025?
In 2025, MOIL Limited remains the largest producer of manganese in India.
What is the future of manganese in India?
India’s manganese demand is expected to rise due to growth in the steel industry, infrastructure expansion, and increasing use in battery technologies.
Who is the second largest producer of manganese in India?
Sandur Manganese & Iron Ores Ltd is the third-largest, while Bharat Manganese and other private miners compete for the second-largest spot, often varying year by year.
What is the use of manganese?
Manganese is primarily used in steel production, battery manufacturing, aluminum alloys, and as a chemical stabilizer.

When did Sandur Manganese share split?
The Sandur Manganese share split took place in September 2023, with a 1:2 stock split ratio.